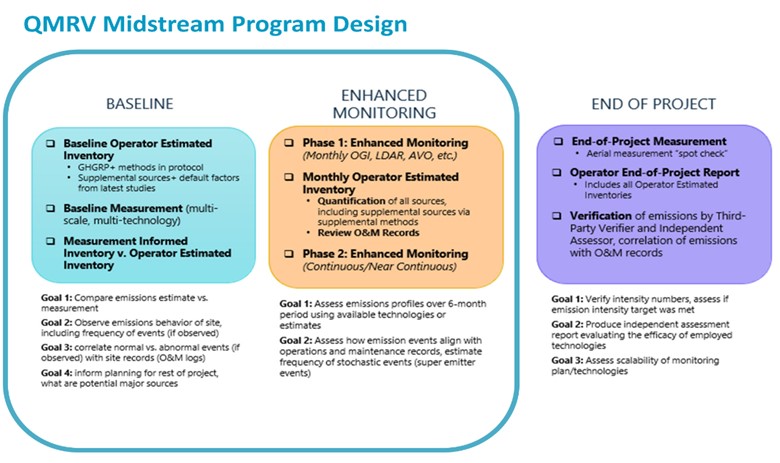
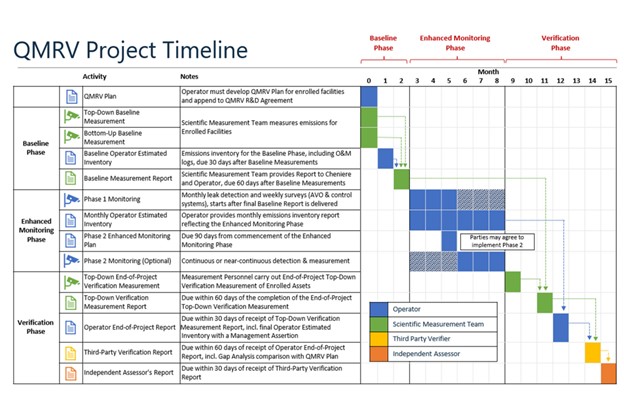
Summary:

The Quantification, Monitoring, Reporting and Verification (QMRV) Project aims to produce an accurate representation of Cheniere’s (a major liquified natural gas (LNG) company) supply chain greenhouse gas emissions. The goal of this project is to improve emissions transparency, verify accuracy of reported emissions, and achieve emissions reductions. There are three phases of the project: A Baseline Phase, Enhanced Monitoring Phase, and a Verification Phase. The Baseline Phase will measure the total facility emissions using Top-Down (TD) (aerial and drone) and Bottom-Up (BU) (ground) technologies to compare against the Operator Estimated Inventory (OEI). The Enhanced Monitoring Phase the Operator will observe and estimate the emissions of the facility each month for 6-months. A measurement technology will come once a month to measure the site emissions. The Verification Phase will be two TD verification measurements of the full-facility emissions at the end of the project.

This study focused on full-facility estimates from TD methods at 15 midstream natural gas facilities in the U.S.A., and were compared with a contemporaneous daily inventory assembled by the facility operator, employing comprehensive inventory methods. CSU is working with SLR (the prime contractor), CSU role in the project is the Scientific Measurement Team – our role is to analyze and verify the data.

Objectives:

  • Reduce emissions across the supply chain, verify accuracy of reported emissions and improve emission transparency;
  • Understand and quantify the emissions from a small select set of enrolled facilities from midstream participants;
  • Demonstrate the effectiveness and limitations of the deployed total site rate quantification methods (two total site aerial measurements);
  • Compare the company inventory to the total site measurements. These should also be informed by other data, such as collected stack testing data provided by the participants;
  • Review results of the selected enhanced monitoring technologies that participants deployed on their midstream facilities (in a monthly review and reconciliation);
  • Produce measurement informed inventories (MII) methods using multi-scale measurements. This will keep inventories up to date and create a more defensible inventory.

Funding Provided by:

Cheniere Energy

Collaborators:

SLR, Cheniere, several other midstream companies

Project overview:

QMRV Project Overview PPT


Baseline

  • Baseline Operator Estimated Inventory
    • GHGRP + methods in protocol
    • Supplemental sources + default factors from latest studies
  • Baseline Measurement (multi-sale, multi-technology)
  • Measurement Informed Inventory v. Operator Estimated Inventory
Goals: 
  1. Compare emissions estimate vs measurement
  2. Observe emissions behavior of site, including frequency of events (if observed)
  3. Correlate normal vs. abnormal events (if observed) with site records (O&M logs)
  4. Inform planning for rest of project, what are potential major sources

Enhanced Monitoring

  • Phase 1: Enhanced Monitoring (Monthly OGI, LDAR, AVO, etc.)
  • Monthly Operator Estimated Inventory
    • Quantification of all sources, including supplemental sources via supplemental methods
    • Review O&M Records
Goals: 
  1. Assess emissions profiles over 6-month period using available technologies or estimates
  2. Assess how emissions events align with operations and maintenance records, estimate frequency of stochastic events (super emitter events)

End of Project

  • End-of-Project Measurement
    • Aerial measurement “spot check”
  • Operator End-of-Project Report
    • Includes all Operator Estimated Inventories
  • Verification of emissions by Third-Party Verified and Independent Assessor, correlation of emissions with O&M records
Goals: 
  1. Verify intensity numbers, assess if emission intensity target was met
  2. Produce independent assessment report evaluating the efficacy of employed technologies
  3. Assess scalability of monitoring plan/technologies
inspecting large engines
Drone flying over Oil & gas equipment
valve assembly

QMRV Project Timeline

ActivityNotesResponsible Party
QMRV PlanOperator must develop QMRV Plan for enrolled facilities and append to QMRV R&D AgreementOperator
Baseline Phase (Month 0-2)Top-Down Baseline MeasurementScientific Measurement Team measures emissions for Enrolled FacilitiesScientific Measurement Team
Bottom-Up Baseline MeasurementScientific Measurement Team
Baseline Operator Estimated InventoryEmissions Inventory for the Baseline Phase, including O&M logs, due 30 days after Baseline MeasurementsOperator
Baseline Measurement ReportScientific Measurement Team provides Report to Cheniere and Operator, due 60 days after Baseline MeasurementsScientific Measurement Team
Enhanced Monitoring Phase (Month 3 - 8)Phase 1 MonitoringMonthly leak detection and weekly surveys (AVD & control systems), starts after final Baseline Report is deliveredOperator
Monthly Operator Estimated InventoryOperator provides monthly emissions inventory report reflecting the Enhanced Monitoring PhaseOperator
Phase 2 Enhanced Monitoring PlanDue 90 days from commencement of the Enhanced Monitoring Phase (parties may agree to implement Phase 2)Operator
Phase 2 Monitoring (Optional)Continuous or near-continuous detection & measurementOperator
Verification PhaseTop-Down End-of-Project Verification MeasurementMeasurement Personnel carry out End-of Project Top-Down Verification Measurement of Enrolled AssetsScientific Measurement Team
Top-Down Verification Measurement ReportDue within 60 days of the completion of the End-of-Project Top-Down Verification Measurement.Scientific Measurement Team
Operator End-of-Project ReportDue within 30 days of receipt of Top-Down Verification Measurement Report, including final Operator Estimated Inventory with a Management Assertion. Operator
Third-Party Verification ReportDue with 60 days of receipt of Operator End-of-Project Report, including Gap Analysis comparison with QMRV PlanThird Party Verifier
Independent Assessor's ReportDue within 30 days of receipt of Third-Party Verification ReportIndependent Assessor

Results:

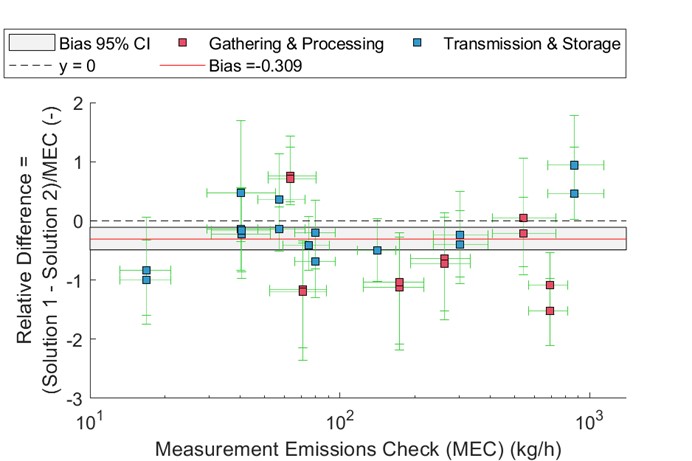
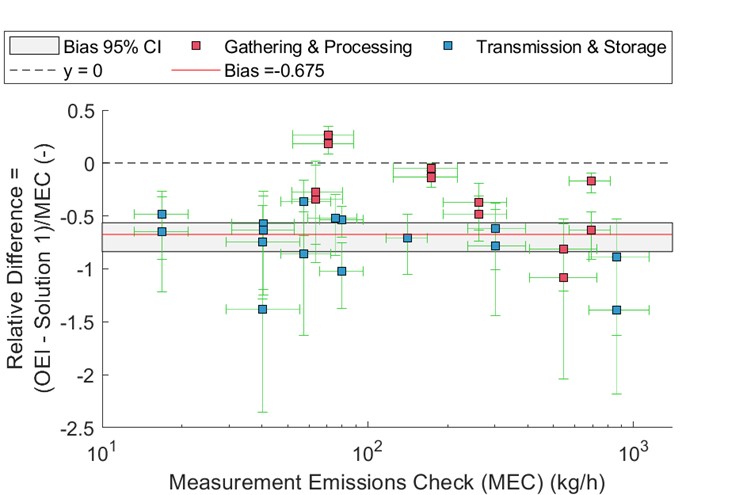
In the baseline phase, the following results were determined: between the two TD measurement methods, there was a 31% difference in the mean over 15 facilities.

Graph displaying the relative difference of measurements with bias analysis on gathering, processing, transmission, and storage.

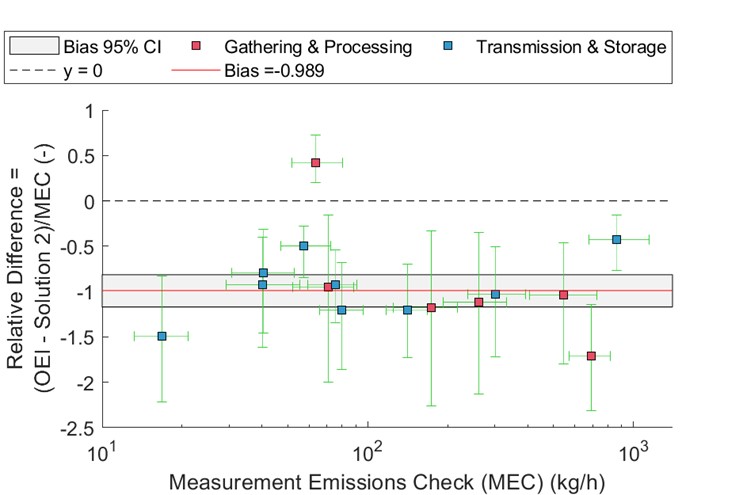
The TD estimates are 68-99% larger than the OEI. Only 2 of 15 facilities were ‘close match’ to at least one TD method. 

Scatter plot showing relative difference in emissions checks by gathering, processing, transmission, and storage methods. Scatter plot comparing relative differences in measurements for gathering, processing, and transmission/storage emissions.
workers at Oil & gas equipment
workers at an Oil & gas equipment
fixed winged aircraft flying overhead

Publication link updates –  

Preprint – Informing methane emissions inventories using facility aerial measurements at midstream natural gas facilities | Energy | ChemRxiv | Cambridge Open Engage 

3 April  – Evaluating Development of Empirical Estimates Using Two Top-Down Methods at Midstream Natural Gas Facilities

     Jenna A. Brown, Matthew R. Harrison, Tecle Rufael, Selina A. Roman-White, Gregory B. Ross, Fiji C. George, and Daniel Zimmerle